Guides
Part of Five kinds of analytics careers, and what actually separates them
Analytics careers case study: the practical version
Analytics careers case built on invented figures: classifying a request queue before hiring against it, and the axis change that cost a quarter of output.
This is an invented case. No real person or company is described, and the point is the reasoning rather than the outcome, because a single outcome proves nothing about a path.
The situation: an organization has one analyst, a growing request queue, and an executive who wants to hire two more. A composite manager has to decide what to do, and the decision is a career decision for the analyst as much as a staffing one.
What to take away
- The queue was not a capacity problem. Three quarters of it was the same four questions arriving in different clothes.
- Hiring against a queue almost always hires the queue into permanence, because the new people are immediately busy.
The starting position
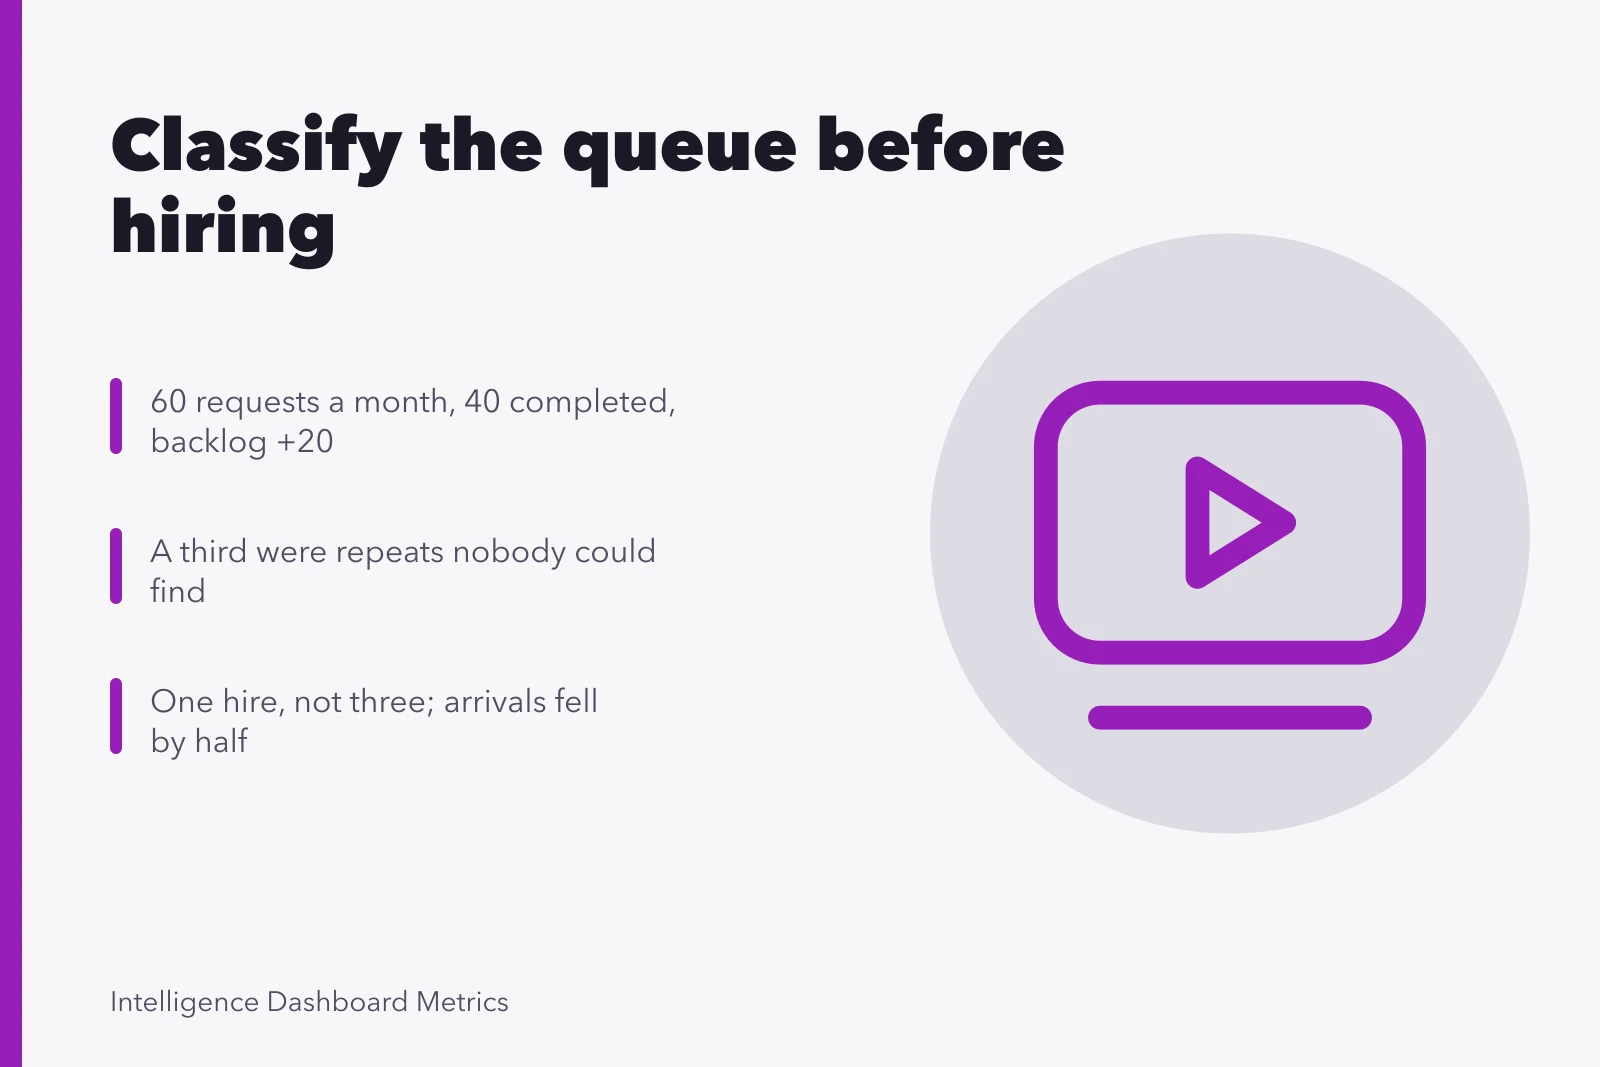
The invented figures, purely to make the shape visible: about sixty requests a month arriving, roughly forty completed, a backlog growing by twenty. The analyst worked long hours, delivered good work, and was regarded as indispensable.
The executive's reading was straightforward: demand exceeds supply, so add supply. It is the reading almost everyone reaches, and it is right often enough that resisting it needs evidence.
What the classification found
Before hiring, the manager spent a week classifying three months of requests. The categories were deliberately crude.
| Category | Share of requests | What the request really was |
|---|---|---|
| Repeat of an answer that already existed | 34% | A findability problem, not an analysis request |
| Definition dispute between two teams | 24% | A definitions problem, not an analysis request |
| Access or permissions query | 17% | An access problem, not an analysis request |
| Genuinely new analysis | 25% | The only category that needed an analyst |
Request queue composition
- Repeat of existing answerabout a third
- Same four questions rewordedabout a quarter
- Genuinely new analysisabout a fifth
- Access or extractabout a sixth
- Data quality reportthe remainder
Two facts fell out. Most of the queue was not analysis at all. And the largest single cause was that answers were not findable, which is a filing problem rather than a staffing one.
Reading the queue by its volume alone would have missed all of this. Judging the situation from the arrival rate, without asking what the arrivals consisted of, is a base rate fallacy in operational form: the striking number was the sixty, and the informative number was the composition.
The decision
One hire rather than three, and a quarter spent on definitions, findability, access roles and routing instead of on the queue.
Four fixes instead of a queue
- Definitions published for four contested concepts
- One findable place for published answers
- Access converted into roles
- Data quality faults routed to source owner
For that quarter, completed requests fell from about forty a month to about thirty two.
What happened, and what it does and does not prove
By the end of the following quarter, arrivals had fallen from about sixty a month to about thirty. Completions had returned to about forty five, and genuinely new analysis had risen from about a quarter of the queue to about half. The single hire was enough.
What this shows is a mechanism: much of an analytical queue is a symptom of missing definitions and missing findability, and treating the symptom with headcount preserves it. What it does not show is that this will happen anywhere else, or that one hire is the right answer to any other queue.
Read your own case rather than this one. The temptation to see your own queue in a story that ended well is confirmation bias with a helpful face on it. The classification exercise takes a week and settles the question with your own data.
The career reading
For the analyst, the quarter of definitional work was the most valuable of their time there, and it was invisible while it happened. It moved them from answering questions to shaping what the organization measured, which is a change of axis rather than a promotion.
It also carried a real risk. Somebody whose visible output falls for a quarter needs a manager who understands why, and without that cover the same choice would have been a bad career move made for good reasons. That dependency is the honest part of this case and the part that generalizes least comfortably.
What to take from it into your own situation
Classify before you scale. Expect the fix to be findability and definitions more often than headcount, and expect the fix to look like a productivity dip, which is the reason the move is rarely made.
And notice who has to sponsor the dip. That person, more than the analysis, decides whether the move is available to you.
Related reading on this site
The kinds of work here are set out in analytics careers. The analyst's axis change is in four axes and a planning pass.
For reading a queue in general, see business intelligence. Definitional work that fixed it is in data governance.
For reading a written-up result skeptically, see how to read a platform case study.
Common questions
Is this a real company?
No. The method transfers; the numbers do not.
Our queue really is all new analysis. What then?
Then you have a capacity problem and should hire, which the classification will have told you in a week. That is a good outcome for the exercise, not a wasted one.
How do we survive a quarter of falling output?
Agree it in advance with whoever reads the output numbers, name the expected dip, and report the composition of the queue monthly so the mechanism is visible while it happens.
Would a bigger team have fixed the findability problem eventually?
Unlikely. A larger team answers more requests, which makes each individual answer less findable and the definitional gaps less painful, so the incentive to fix them weakens as capacity grows.