Reviews
Online business ideas metrics and the details that decide it (2027 update)
Online business ideas metrics that follow a stranger from first sight to second payment, with what to count at each step and which numbers to ignore.
An online venture produces more numbers than any other kind of business, and most of them are useless. Views, followers, impressions and visits are counted for you, for free, by platforms whose interest is that you keep watching them.
This page walks the path a stranger takes from first seeing you to paying you a second time, and says what to count at each step and how. It gives no target figures: what is a good ratio for a subscription is a bad one for a one-off sale, and any number set here would be wrong for yours.
What to take away
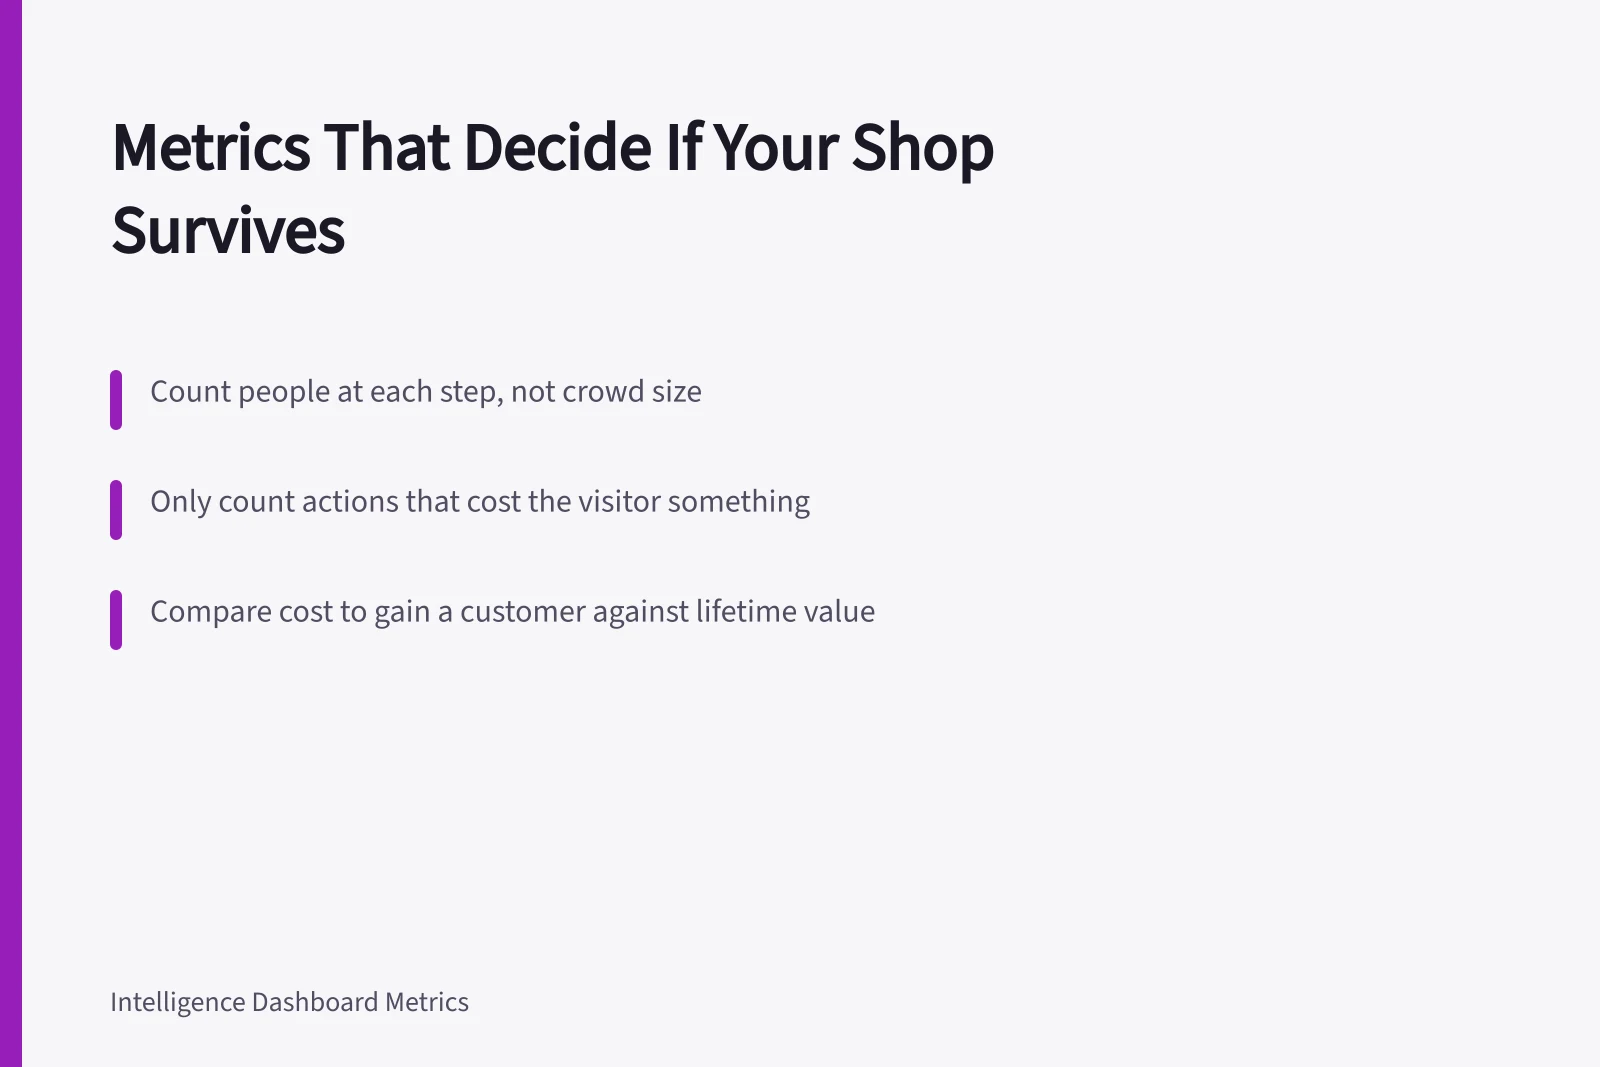
- Measure the steps a stranger takes, not the size of the crowd. Each step should be a count of people, and each pair of steps a ratio.
- Only count actions that cost the visitor somethingattention is free, and free things do not predict payment.
- The two numbers that decide survival are what it costs to gain a customer and what a customer pays over their whole relationship with you, compared against each other.
The path, step by step
| Step | What to count | How to get it | The mistake |
|---|---|---|---|
| Reached | People who could have seen the offer | Platform reporting, treated as an estimate | Reporting it as if it were interest |
| Visited | People who arrived at a page you control | Your own analytics, on your own site | Counting bots and your own visits |
| Acted | Sign-up, sample request, deposit, add to basket | Your form or store's own log | Counting clicks that cost nothing |
| Paid | First payment received | Your payment record, not the platform's dashboard | Counting orders before refunds |
| Returned | Second payment, or renewal | Same record, matched by customer | Assuming a first sale predicts a second |
Each row counts distinct people over the same period. Every ratio between neighboring rows marks a place where people are lost. The worst ratio shows where the work is.
Stranger to second payment
- Reached: could have seen the offer
- Visited: arrived at your page
- Acted: sign-up, sample, deposit
- Paid: first payment received
- Returned: second payment or renewal
The structure holds whether you sell time, goods, software or membership. The pillar on online business ideas describes two kinds of online business, and both are measured this way.
Where to get honest numbers
Platforms report reach generously, because reach is what they sell. Treat their figures as an upper bound and never as a count of people who noticed you.
One sheet, filled weekly
- One row per week
- One column per step
- Fill in same day each week
- Twelve weeks beats any dashboard
- Use records you control
- If sources disagree, money is right
From the visit step onward, use records you control: analytics on your own pages, your forms, your payment account. If two sources disagree, the one showing money is right.
Those records are what a tax authority expects. The IRS list of records a business should keep is a reasonable minimum to build the sheet around.
Keep one sheet with a row per week and a column per step. Fill it in on the same day each week. Twelve weeks of that sheet is worth more than any dashboard, because it shows direction, and direction is the only thing a small venture can act on.
Cost to gain a customer
Add up everything spent in a period to be seen: advertising, content production tools, and your own hours at a rate you would accept from someone else. Setting that rate is its own exercise. The guide to ideas by skill belongs there.
What a customer costs
- Advertisingspend to be seen
- Content toolsproduction spend
- Your hoursat a rate you would accept
- Divide bypeople who paid
Working out who you are trying to reach is the research the SBA sets out under market research and competitive analysis.
Divide by the number of people who paid in the same period. That is what a customer costs you. If most of your spend is hours, the figure will be dominated by your own time, which is correct and often sobering.
What a customer pays over time
Take the customers who first paid in a given month and follow them. Add up what each has paid since, and how many are still paying or still buying. After a few months you will have a rough picture of what a customer is worth over the whole relationship rather than at the first sale.
Cost versus lifetime value
Cost to gain
- What to add
- Ads, tools, your hours
- Period
- Same period as payments
- Also count
- Your own time rate
- Direction
- Higher means shrinking
Customer pays over time
- What to add
- Payments since first sale
- Period
- Follow a month's cohort
- Also count
- Still paying or buying
- Direction
- Higher means tolerating more
Set this against the cost above. There are no right values, only a direction: a venture where gaining a customer costs more than that customer will ever pay is shrinking, however busy it looks.
ideas by profit model explains why subscription, one-off and service models produce different shapes here. A model with repeat payment can tolerate a higher cost per customer than one without.
Refunds, chargebacks and returns
Count them as a share of paid orders, by month, and read the reasons. A rising share is the earliest warning you will get that the product, the description, or the delivery has a problem, and it arrives long before reviews do. For goods, add the cost of returned stock you cannot resell.
Channel concentration
Once a month, list each paying customer's source, as best you can tell. Note the largest single source's share.
No share is correct, but one rising toward the whole is a dependency. Platform dependencies end on the platform's schedule. The pillar's response: move buyers to a channel you own. This metric shows how urgently.
Time to first value
For services and software, note how long a new customer takes from paying to getting what they paid for: the first deliverable, the first successful use. Long gaps here predict refunds and silence. Short ones predict the second payment.
Reading the sheet
Read the ratios rather than the totals, the trend rather than the week, and the money columns before the audience columns.
The startup budget guide explains why cash timing kills faster than any single cost. On this sheet, the gap between the "paid" column and the money actually landing in your account is where that timing lives, and it is worth a column of its own.
Common questions
Do followers count for anything?
They are a reach estimate. Count them if you like, but never let them stand in for any later step.
How long before the numbers mean anything?
When each step has enough people in it that one person does not move the ratio. For most new ventures that is months, and the sheet is still worth keeping from week one.
Which single number would you watch?
The ratio of people who acted to people who paid, because it is the step you control most directly and the one that changes fastest when the offer improves.