Features
Mining SEC EDGAR filings for competitive intelligence dashboards
How to pull EDGAR full-text search, XBRL company facts and filing cadence data into dashboard-ready competitive intelligence metrics for US analysts.
What to take away
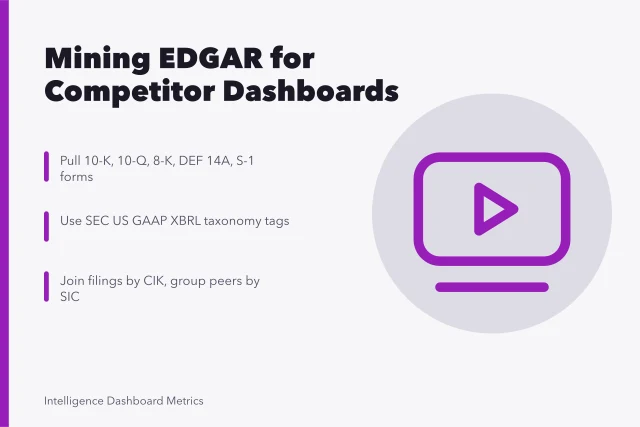
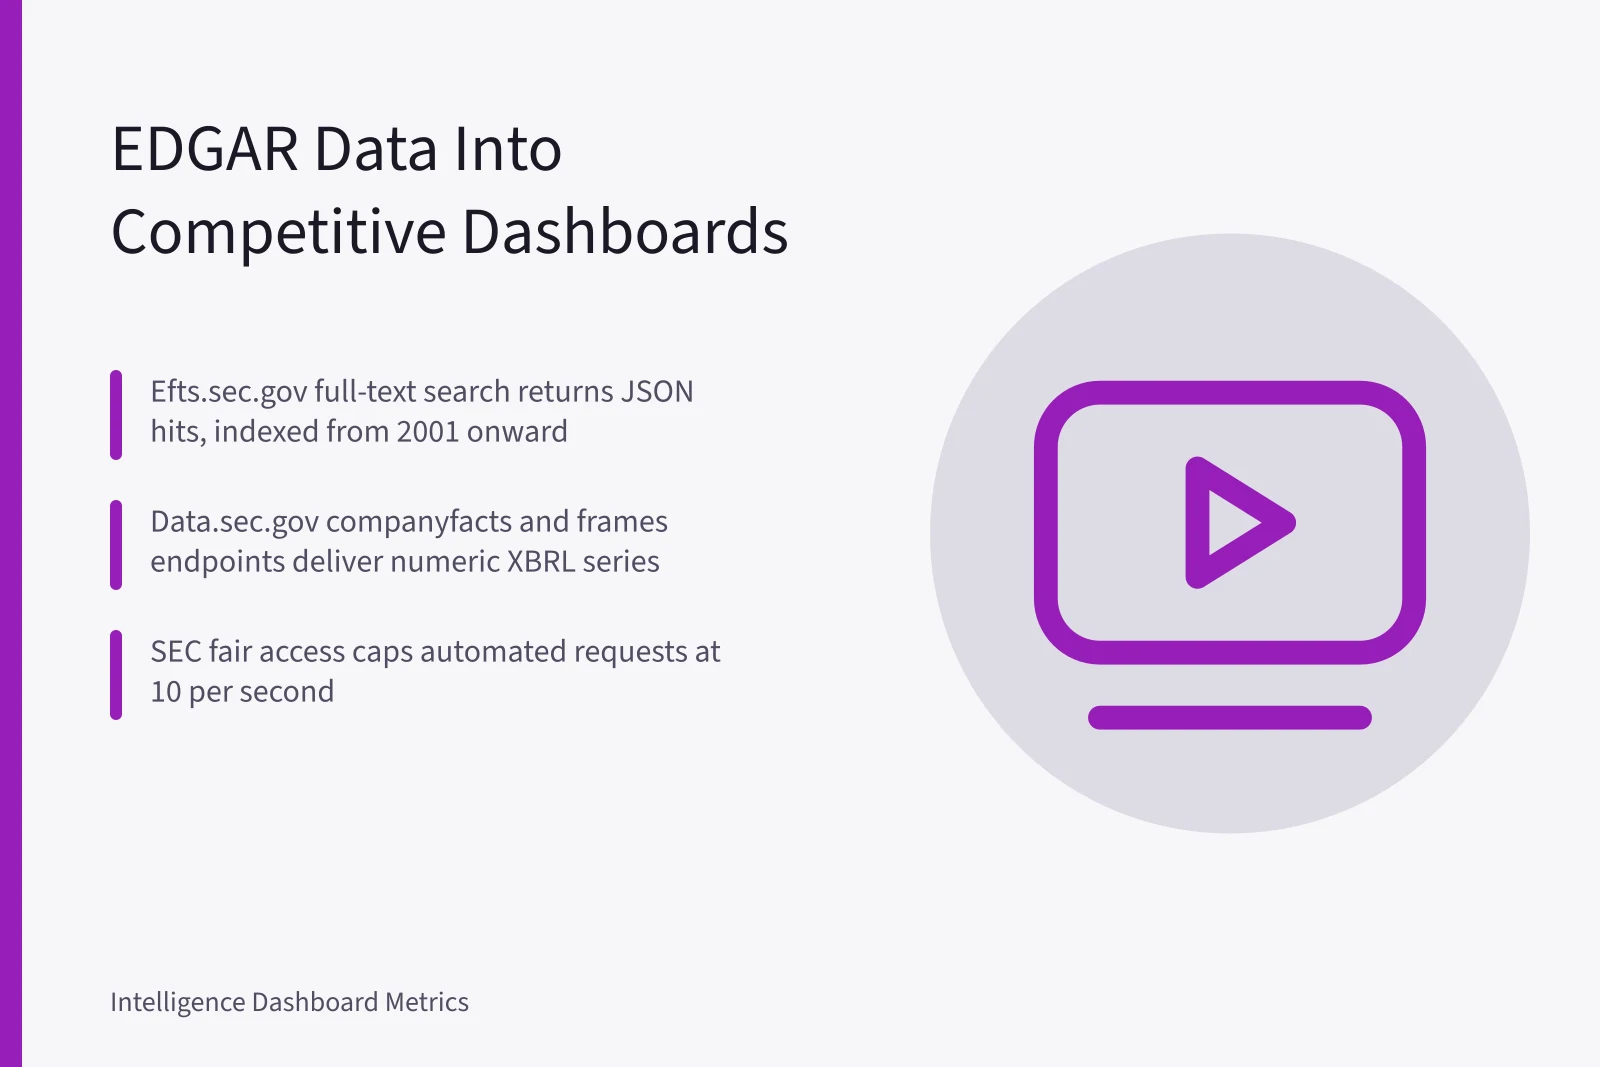
- EDGAR full-text search runs at efts.sec.gov and indexes filings from 2001 onward, so long keyword trends on Item 1A stay comparable.
- The XBRL endpoints at data.sec.gov return numeric series as JSON, which removes most HTML parsing from a pipeline.
- Filing cadence signals such as acceptance timestamps, 8-K clustering and NT 10-K notices are cheap to collect and often lead price moves.
- SEC fair access rules cap automated requests at 10 per second and require a declared User-Agent with a contact address.
- Fix CIK and SIC mapping before you collect anything, because competitor sets drift once tickers change.
EDGAR full-text search and its query parameters
The full-text search endpoint lives at efts.sec.gov and returns JSON rather than HTML. A typical call passes q for the phrase, forms for a comma separated list of form types, and dateRange or startdt and enddt for a window.
Results arrive as hits, each with a source block holding the file date, form type, display names and the entity CIK. Highlight snippets show where the phrase landed inside the document.
The index starts in 2001. Anything older has to be pulled from the EDGAR Archives directory and parsed locally.
The public search page at sec.gov/edgar/search reads the same index, which makes it a quick way to test a phrase before you automate it.
XBRL company facts versus the frames endpoint
Two endpoints at data.sec.gov do most of the numeric work. companyfacts returns every us-gaap and dei fact a filer has tagged, keyed by CIK. companyconcept narrows that down to a single tag.
Frames answer a different question. They return one concept for every filer in a single period, which is how you rank a peer group without downloading each company in turn.
Tag drift is the trap. Many filers moved from Revenues to RevenueFromContractWithCustomerExcludingAssessedTax after ASC 606 took effect, so a working series can break with no change to the filing itself.
Filing cadence as a competitive signal
Every submission record in the submissions JSON carries an acceptance datetime. Plot those across a year and the rhythm becomes visible: late 10-K notices, abrupt 8-K clusters, and proxy statements that arrive weeks ahead of the usual March to May window.
Cadence metrics need no text parsing, only the filing index. They are also the tiles a sales or corporate development team reads first, because a sudden 8-K often precedes a public announcement.
| Source | Metric | Refresh |
|---|---|---|
| efts.sec.gov full-text | Phrase mention counts by form | Daily |
| data.sec.gov companyfacts | Tagged financial series | Daily |
| submissions JSON | Filing cadence and form mix | Hourly |
A four-step pipeline from raw filings to dashboard rows
A four-step pipeline
- Resolve identity. Pull the submissions JSON per CIK. Store former names, the SIC code and ticker history so a merger does not split one company into two rows.
- Retrieve text. Query efts.sec.gov with the target phrase and a form filter, then cache highlight snippets instead of full documents.
- Retrieve numbers. Call companyfacts once per CIK and keep only the tags on your metric list.
- Normalize and load. Align fiscal periods, restate prior years where the filer did, and write one row per company per quarter.
Example: counting Item 1A risk factors
Take a peer group of ten issuers. For each one, pull the latest 10-K, isolate Item 1A, and count risk factor headings plus total words in the section.
A rising count alongside flat revenue is worth a dashboard tile. So is the share of risk sentences that did not appear in the prior year's filing.
Run the same phrase list through full-text search across the group to see which competitor mentions a term first. The first mover is usually visible months before a press release.
Governance, access and the analysis layer
The SEC publishes fair access guidance. Stay at or under 10 requests per second, and identify your client in the User-Agent header with a contact address. Ignoring that gets an IP blocked.
Once the data lands, the dashboard layer is ordinary business intelligence work. Start with metric definitions, and check a business intelligence overview so finance and product teams agree on the shared vocabulary.
Chart choice matters more than most teams expect. A time series of risk factor counts needs one visual grammar, so it helps to apply data visualization principles when you pick the chart.
Most teams end up in Power BI, Tableau or an embedded tool. Power BI pricing and refresh limits decide how often a filing pipeline can realistically run.
Teams that pair filing metrics with clinical, trial or claims data hit stricter rules. The governance model behind Boston biotech dashboard teams is worth reading before you merge those sources.
When the question turns interpretive, form selection and tag normalization get their own treatment in the analyst workflow for EDGAR competitive dashboards.