Features
Dashboard metrics benchmarks: what US analytics teams actually report in 2027
Reported benchmark ranges for dashboard refresh cadence, adoption, KPI counts, and time-to-insight across US analytics teams, with later compliance costs.
Dashboard metrics benchmarks: what US analytics teams actually report in 2027
What to take away
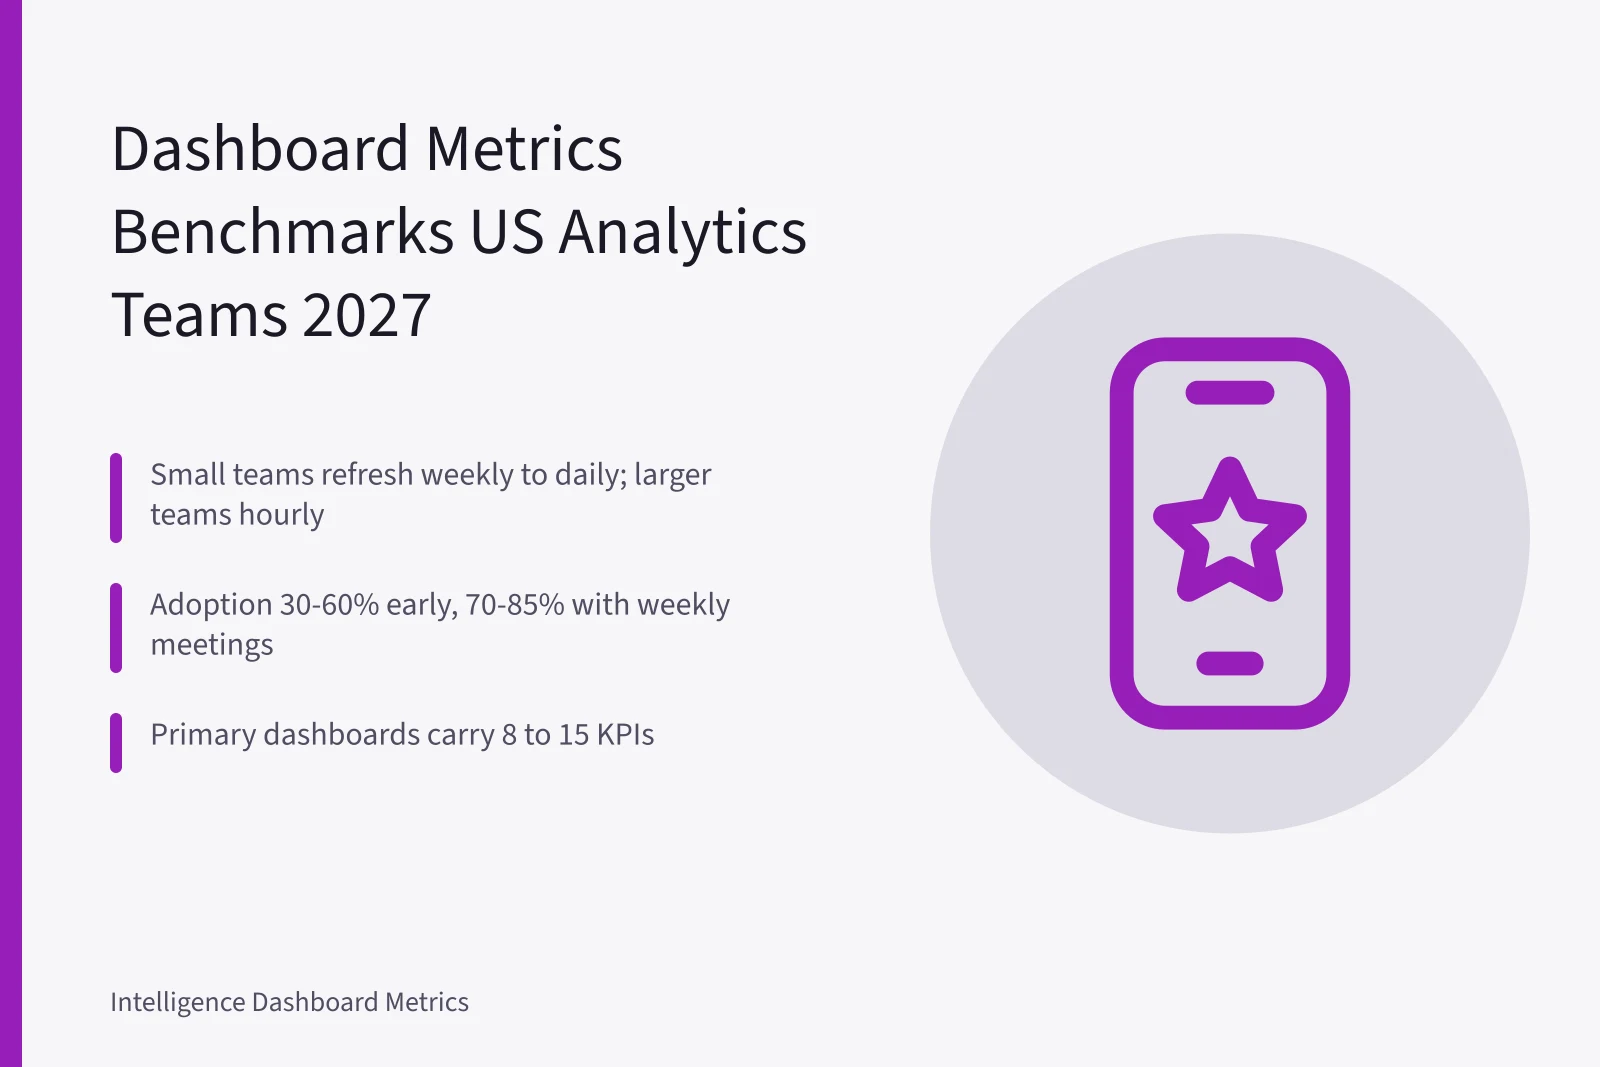
- Refresh cadence tracks team size more than industry. Small teams settle on daily executive views, larger teams push operational dashboards to hourly or faster.
- Licensed-seat adoption commonly lands between 30 and 60 percent in the first two quarters, then rises to 70 to 85 percent when a dashboard feeds a standing weekly meeting.
- Primary dashboards carry 8 to 15 KPIs. Past 20, load times, definition arguments, and distrust of the totals all increase.
- Time-to-insight runs 2 to 10 business days for centralized teams and stretches when data ownership is split.
- Accessibility and privacy duties add fixed, recurring cost that rarely appears in the first business case.
Refresh cadence benchmarks by team size
Cadence is the metric teams argue about most, and the one most correlated with analyst headcount rather than sector. The practical detail is set out in PIPEDA dashboard compliance metrics for Canadian.
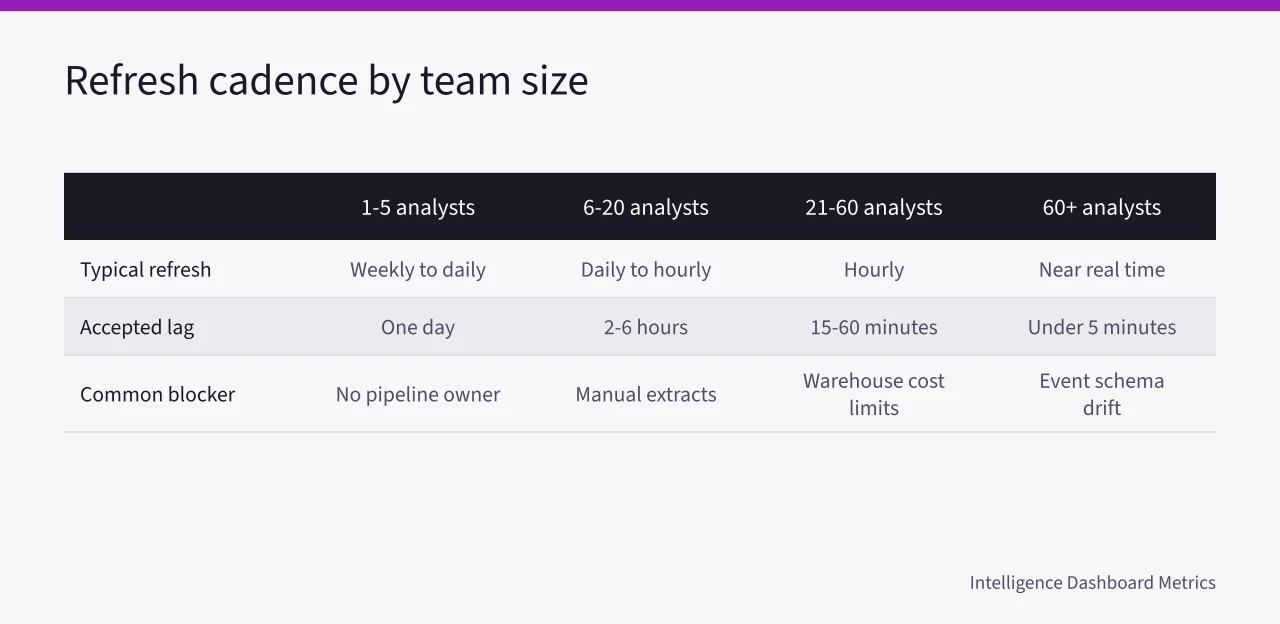
| Team size (analysts) | Typical refresh | Accepted data lag | Common blocker |
|---|---|---|---|
| 1 to 5 | Weekly to daily | One day | No pipeline owner |
| 6 to 20 | Daily to hourly | 2 to 6 hours | Manual extracts |
| 21 to 60 | Hourly | 15 to 60 minutes | Warehouse cost limits |
| 60 and above | Near real time | Under 5 minutes | Event schema drift |
Industries diverge less than outsiders expect. Retail and logistics skew faster on inventory and delivery views. Insurance and healthcare keep claims and clinical dashboards on daily cycles because the records settle slowly.
For the maturity levels and failure rates that sit behind these cadences, the site's analytics foundations data statistics page is the reference point.
Adoption rates and KPI counts
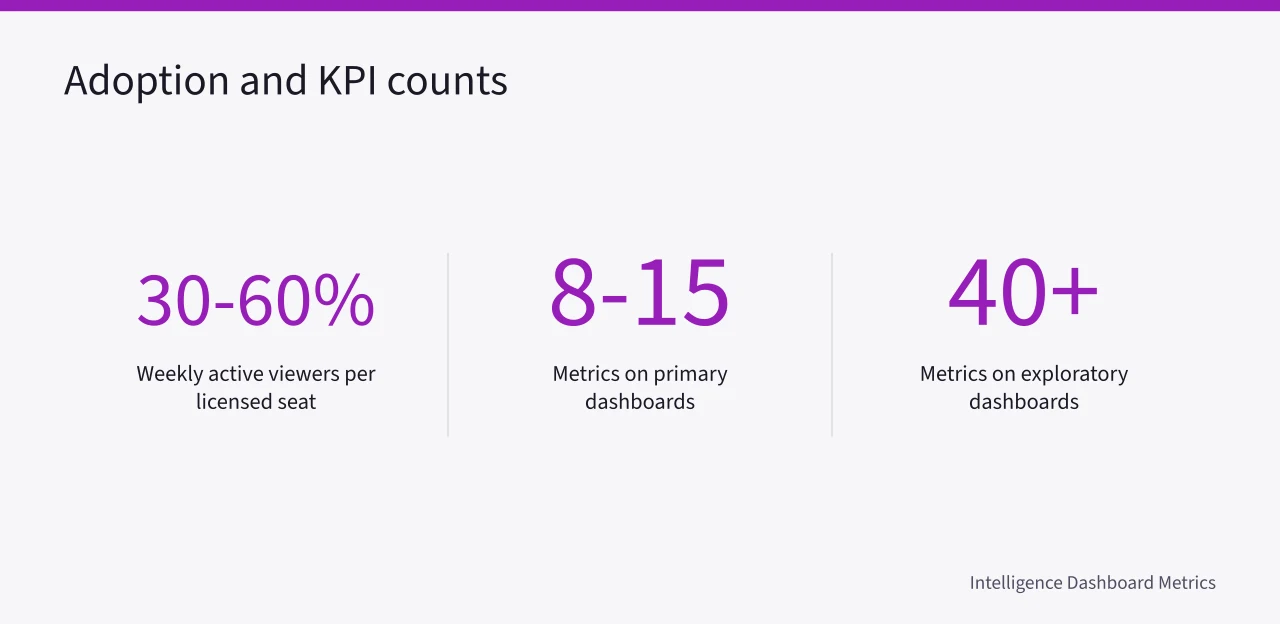
Adoption is usually measured as weekly active viewers divided by licensed seats. Reported ranges cluster between 30 and 60 percent in the first two quarters.
Teams that tie a dashboard to an existing meeting report materially higher numbers. The dashboard becomes the agenda, and the agenda drives logins.
Adoption problems are usually decision problems. If no meeting depends on the number, the number is decoration.
KPI count follows a similar pattern. Primary dashboards settle at 8 to 15 metrics. Exploratory dashboards can carry 40 or more without harm, because nobody treats them as a scoreboard.
For reported KPI counts segmented by team size, the site's dashboard KPI reporting benchmarks page collects the underlying figures.
Time to insight by operating model
Time-to-insight measures the gap between a business question and a published, trusted answer.
Centralized teams report 2 to 10 business days for a new metric. Federated teams with clear ownership often report 1 to 5 days, but only where a shared semantic layer exists.
The slow steps are rarely technical. Definition debates, access requests, and review sign-off consume most of the calendar.
- Agree the metric definition in writing before the build starts.
- Ship a rough chart in days so the debate has something concrete to argue about.
- Automate the extract so the number survives past week one.
- Publish a freshness timestamp on every tile.
The site's time to first insight benchmarks page tracks how US teams measure that gap and where it stalls.
Example: a 40-person insurer analytics team
This sequence repeats across US carrier and broker analytics groups.
- Audit the 12 dashboards with the most viewers and retire any without a named owner.
- Standardize 14 core claims and premium metrics in the semantic layer.
- Move the executive view to a 6 a.m. daily refresh and the claims operations view to hourly.
- Add a freshness badge and a metric dictionary link to each tile.
The team reported adoption rising from roughly 35 percent to just under 70 percent of licensed seats within two quarters.
Compliance costs that show up later
Accessibility is the cost line most business cases omit. Federal agencies must meet Section 508, which covers dashboards as information technology. The Section 508 law and policy summary explains the scope.
Private teams often adopt the same bar. WCAG 2.1 criteria give designers concrete contrast, keyboard, and labeling targets, and the WCAG 2.1 quick reference is the checklist most teams test against.
Canadian operations add a second layer. Insurers handling personal data fall under PIPEDA, and the regulator's brief sets out consent and retention duties that shape what a dashboard may display. Read the PIPEDA requirements brief.
Budget this work in the first release, not the audit. Retrofitting labels, alternative text, and row-level filtering onto a live dashboard costs more than designing them in.
The site's cost and compliance benchmark data page covers the cost and compliance figures behind this section.