Industry
Part of Grading a forecasting cycle honestly before anyone trusts it
Forecasting tools compared by class, then tested until one fails
Forecasting tools compared by class, from Excel and Prophet to Anaplan and Databricks, then stress tested with rolling forecasts until one fails.
Forecasting tools sort into four classes before any brand matters. Microsoft Excel, Meta's Prophet, Anaplan and Databricks each sit in a different one. The class you need is set by how many series you run and how often a person overrides the number.
Each class below names its products, with published prices where vendors list them, and a trial built so the test can fail rather than flatter the tool.
What to take away
- Series count and override frequency pick the class. Work both out before you open a pricing page.
- Published prices run from free for Prophet and Google Sheets to $12.50 per user per month for Microsoft 365 Business Standard. Anaplan and Pigment publish nothing and quote per engagement.
- A team adjusting nearly every forecast every cycle has a workflow problem, and no statistical package fixes it.
- The costs that end a forecasting setup are reproducibility and handover, and neither shows up in an accuracy-only test.
- Run the trial on your worst series, set the pass condition in writing, and let a second person attempt the handover.
The four classes, by name
Spreadsheets. Microsoft Excel and Google Sheets. Microsoft 365 Business Standard lists at $12.50 per user per month, and Sheets is free with a Google account. Excel's FORECAST.ETS functions cover seasonal series, and Sheets caps a file at 10 million cells. The class fails on volume, on version history, and when the builder leaves.
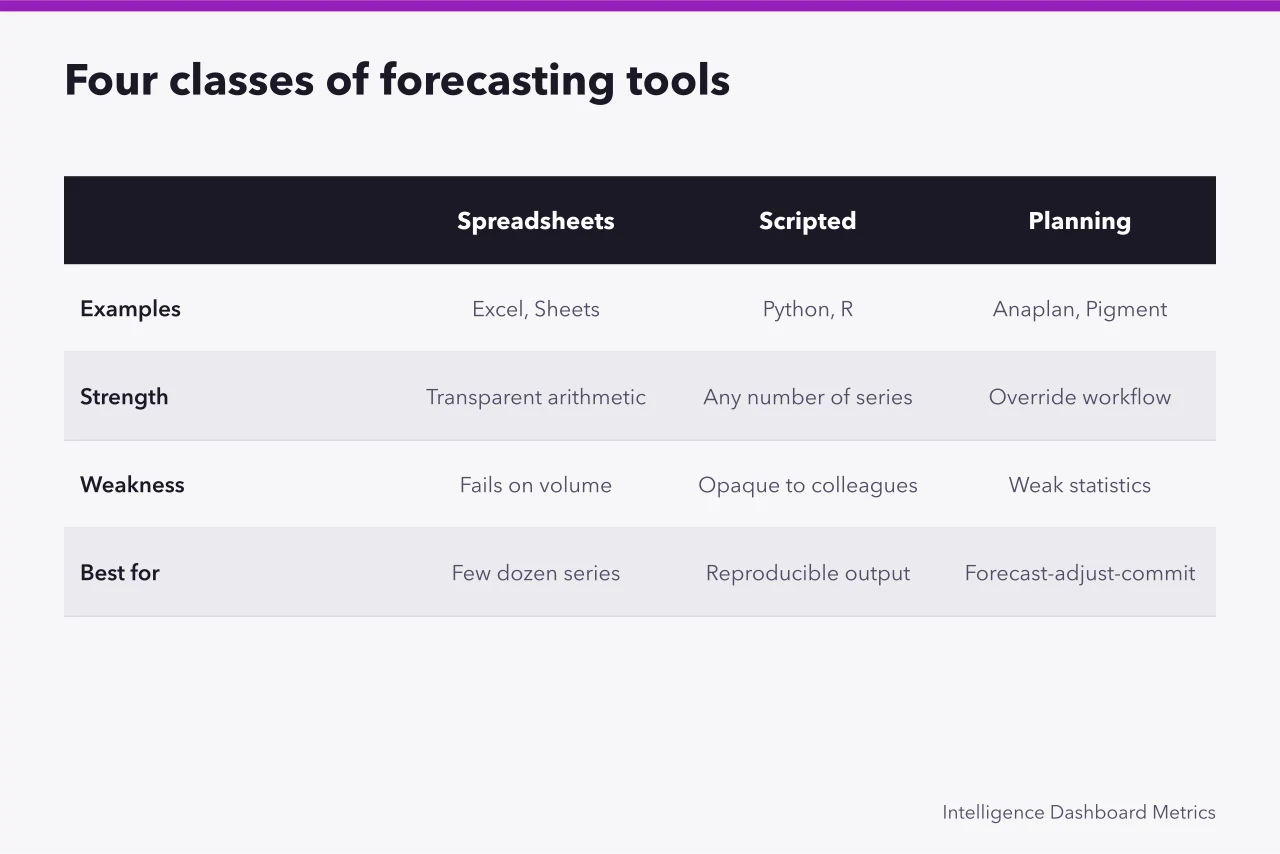
Scripted environments. Python with Prophet, statsmodels or scikit-learn; R with the forecast package and fable. All are open source, so the license cost is zero and the engineering time is not. Nixtla's StatsForecast covers similar ground in Python, and both languages regenerate a past forecast from a stored script and a pinned environment.
The tradeoff is that a non-technical colleague cannot inspect the calculation. Version control keeps the change history, and a script nobody else maintains becomes the handover problem the tool was meant to solve.
Planning applications. Anaplan, Oracle Planning and Budgeting Cloud, SAP Analytics Cloud, Pigment and Workday Adaptive Planning. Vena sits in the same class and keeps Excel as its front end. All six are built around the forecast, adjust and commit cycle, with overrides, approvals and audit trails included.
Oracle and SAP publish rate cards, and planning editions typically list in the tens to low hundreds of dollars per user per month before any annual minimum. Anaplan, Pigment and Vena quote per engagement and publish nothing. You buy the workflow, not the statistics. Judging one on forecast accuracy alone misses what it is for.
Embedded components. Forecasting ships inside Snowflake, Databricks, Amazon Forecast, Power BI and Tableau. Power BI Pro lists at $14 per user per month, and Tableau Creator at $75 with Viewer at $15. Snowflake compute runs about $2 to $4 per credit, and Databricks bills by DBU at different rates for jobs and all-purpose clusters.
Methods and granularity follow the host, so a BI tool inherits the limits of the model behind it. Amazon Forecast is closed to new customers, so check the current status before you commit; AWS points new forecasting work at SageMaker.
The five properties that decide it
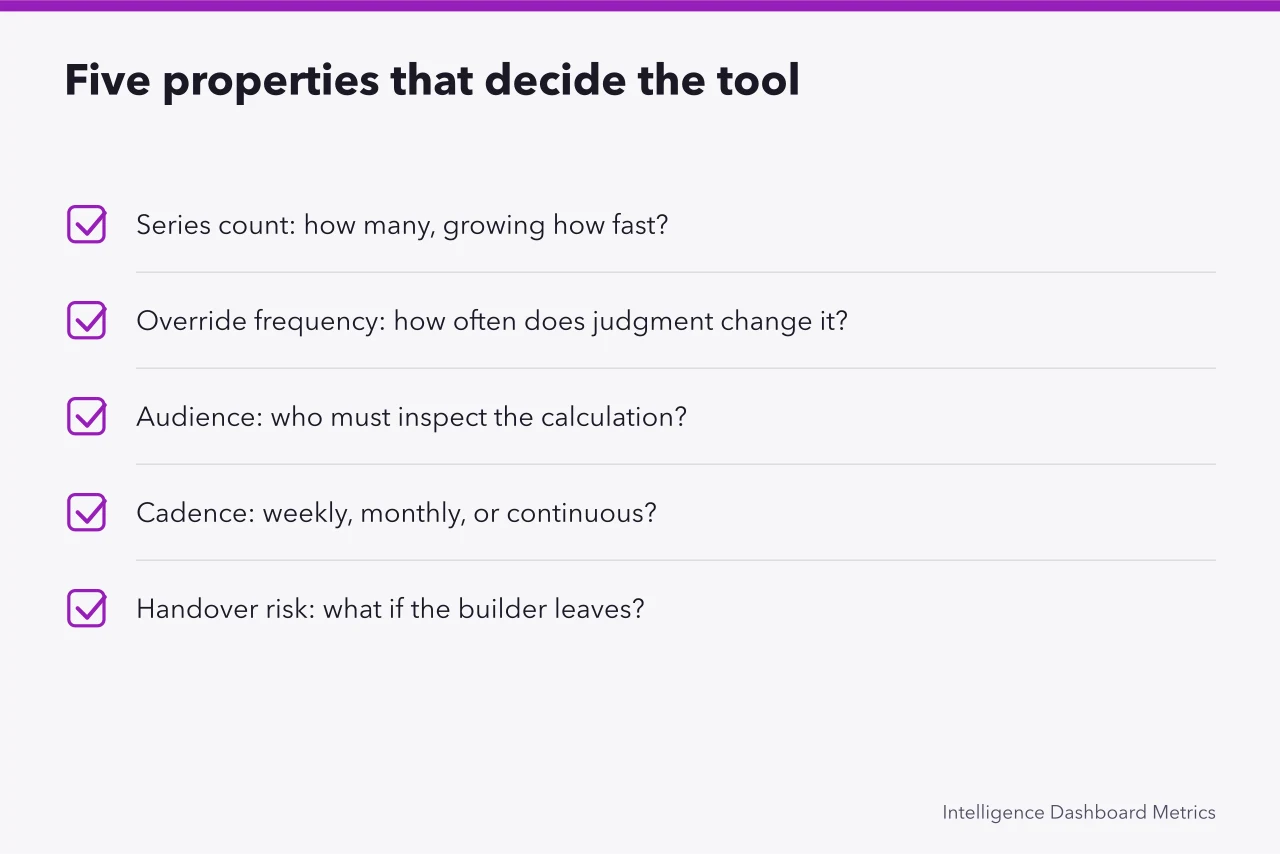
| Property | The question to answer first | Why it decides |
|---|---|---|
| Series count | How many independent series, growing how fast? | Manual review stops scaling past a few dozen |
| Override frequency | How often does judgment change the number? | Frequent overrides need workflow, not better math |
| Audience | Who must be able to inspect the calculation? | Sets whether opacity is acceptable |
| Cadence | Weekly, monthly, or continuous? | Continuous rules out anything with a manual step |
| Handover risk | What happens when the builder leaves? | The most common cause of abandonment |
The override row is the one teams skip, and it decides more often than the rest. Anaplan and Pigment exist because of that row, not because their statistics beat Prophet's.
Reproducibility is the property to test hardest
The question is whether someone else, six months on, can regenerate last quarter's published forecast exactly. That is reproducibility in the ordinary scientific sense. It decides whether you can ever explain why a past forecast was wrong.
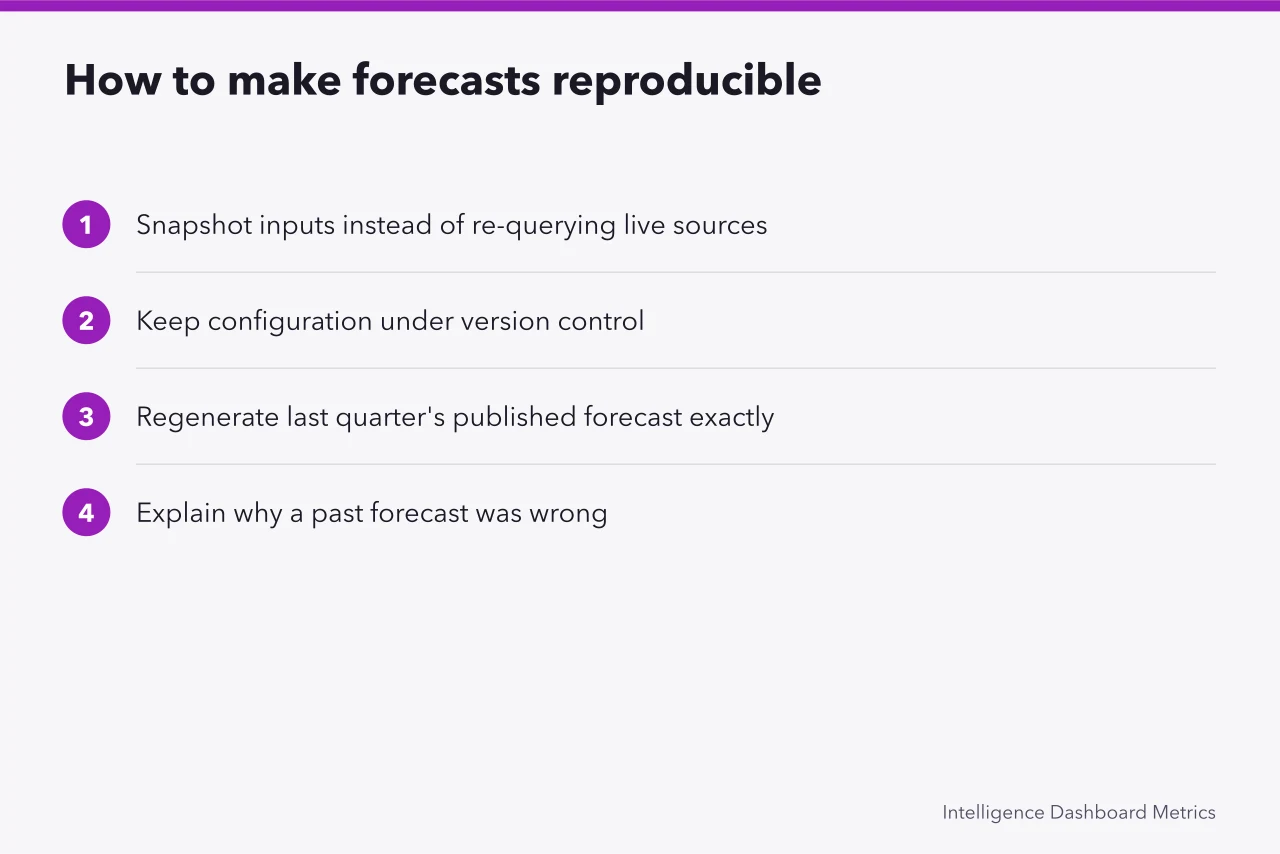
Inputs must be snapshotted rather than re-queried, because a live query against a restated source reproduces nothing. Configuration must sit under version control rather than as the current state of a file people edit.
A scripted environment gives you both by default. Excel and Sheets give you both with dated copies and a stored extract, which most teams never set up.
The plumbing no forecasting tool provides
Someone still has to assemble the history: pull the source data, align the calendar, handle definitional breaks, mark the gaps. That is ordinary extract, transform, and load work, it is most of the ongoing effort, and it is identical across Excel, Prophet, Anaplan and Databricks.
Price that work before you compare tools. A planning application bought to solve a data assembly problem will not solve it, and you will have paid to learn that.
A trial that can fail
Three rules make an evaluation informative, and the third is the one most teams skip.
- Use your own series, including the ugly ones: the intermittent series, the one with a definitional break, the product with four months of history. A trial on your three best-behaved series proves nothing.
- Write the pass condition before you start. For example: reproduces a stated past forecast exactly, handles the intermittent series without breaking, and lets a named non-specialist log an override in under ten minutes.
- Hand the documentation to someone who did not build the trial and have them produce next period's forecast alone. Most trials fail this, and most evaluations never run it.
Run the three steps in order and the first failure usually lands in the same place. A spreadsheet fails step three once the series count passes a few dozen and the builder has left.
A scripted environment passes steps one and two and fails step three, because nobody outside the builder can drive it. A planning application fails step one when the ugly series needs data work nobody scoped.
An embedded component fails step two when the host's methods or granularity cannot hold the intermittent series. Amazon Forecast fails earlier, on availability. A failure is only useful if the pass condition was written down first.
When the answer is to buy nothing
Under a few dozen series, reviewed monthly, by people who want to see the arithmetic, the answer is usually a spreadsheet with stored baselines, dated snapshots and a written override log. That satisfies every requirement that matters here and costs nothing.
Reconsider when series count passes what one person can review, when cadence outruns a person, or when overrides need approvals a file cannot enforce. The method itself is in how forecasts are built and reviewed, and the structure the tool must support is in a forecast register and a review cycle.
For the layer you shop, see buying analytics tooling, and for evaluation and lock-in more broadly, how to compare intelligence platforms. The publication end is covered in building a report worth keeping.
Common questions
Everyone in our sector uses one product. Is that a reason?
It is a reason to find out why, not to buy. Sector concentration usually reflects an integration with an operational system rather than forecasting quality, and if you do not run that system the argument does not transfer.
Can we start in a spreadsheet and migrate later?
Yes, and it is usually the right sequence, provided inputs and the override log stay in a form that can move. What does not migrate is arithmetic buried in undocumented cell formulas.
How long should a trial run?
At least two full cycles of your cadence, so you see a handover, a source failure and an override. One cycle shows you the happy path only.
Who should run the evaluation?
Whoever maintains it in year two, not whoever is most enthusiastic in year one. Those are rarely the same person, and the second one asks better questions.